Plots
Unit tests provides convenient plotting utilities for visualizing measured data, trends, and distributions. Below are a couple of examples of plots that can be generated using the provided plotting functions.:
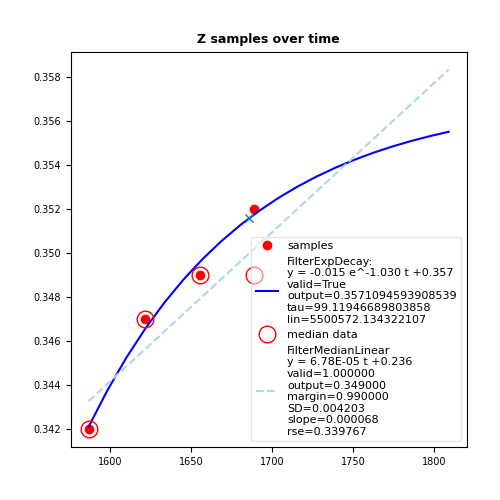
Example of an Z-samples over time
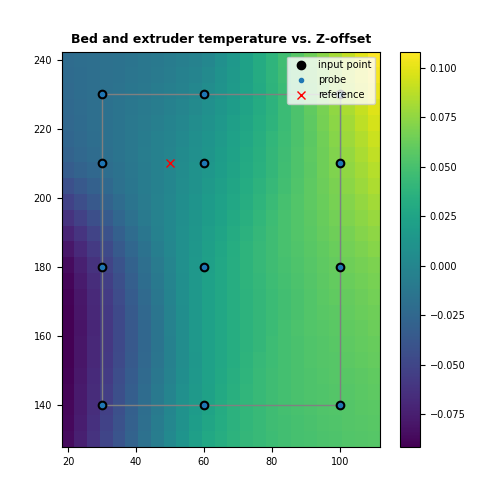
Example of a Z-offset over bed and extruder temperatures